miseryLovesCompanyProject
Main menu:
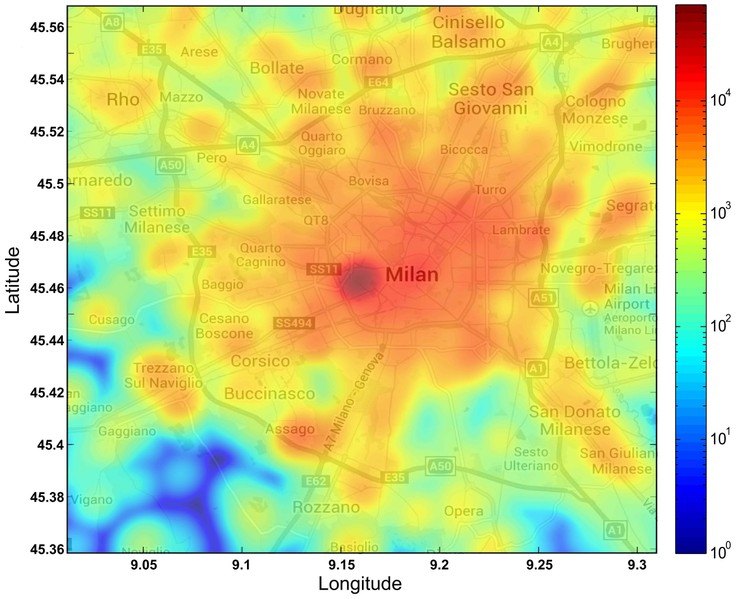
Heat map of the number of tweets in Milan.
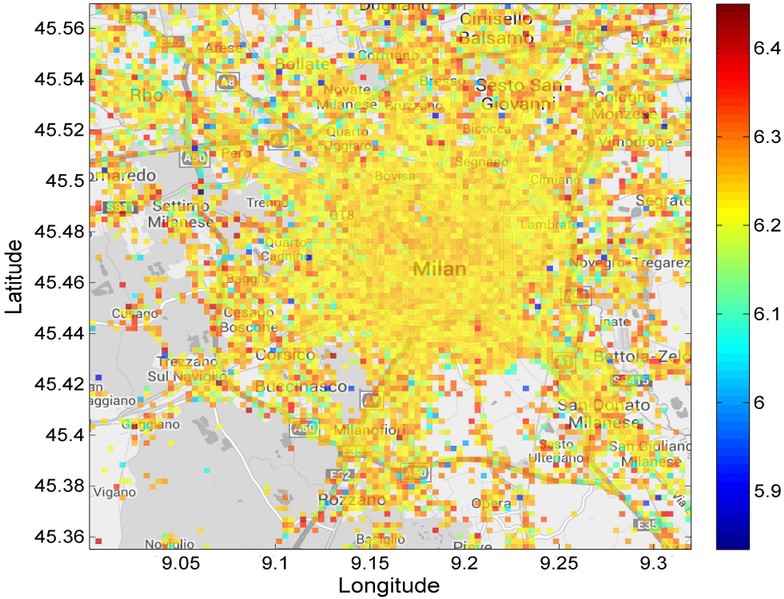
Intensity of the happiness score of each area. Red areas have high happiness scores, while blue areas have low happiness scores.
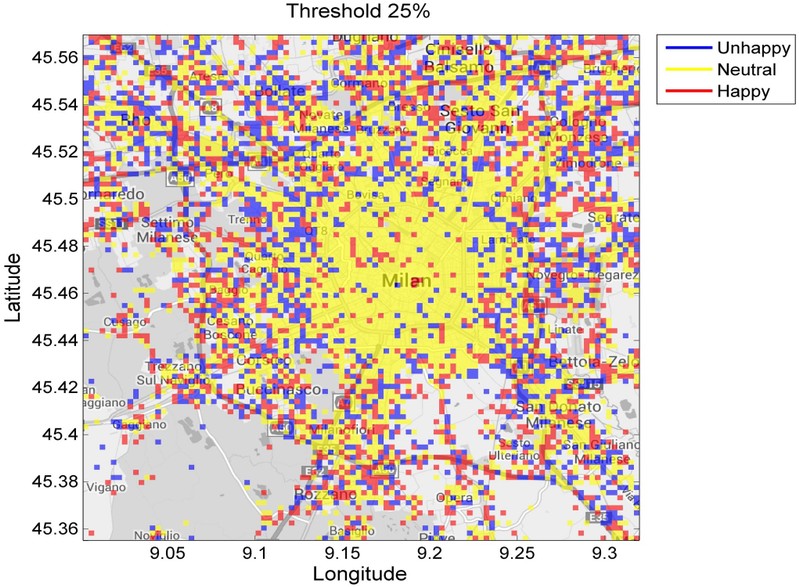
Happiness category (happy, unhappy, or neutral) of each cell.
Misery Loves Company: Happiness and Communication in Cities
Aamena Alshamsi, Edmond Awad, Maryam Almehrezi, Vahan Babushkin, Pai-Ju Chang, Zakariyah Shoroye, Attila-Péter Tóth, Iyad Rahwan
Life in society would be impossible without communication between its members. Many factors influence the intensity and frequency of social interaction, including population density, happiness level and many others. People living in cities might appear to be in a more advantageous position in terms of availability of partners to communicate. To study a relationship between urban happiness and communications we consider Tweets and mobile communication intensity data from the city of Milan. Our analysis revealed that happy (respectively unhappy) areas preferentially communicate with other areas of their type. The discovery of a sentiment-based homophily between different town districts potentially can be implemented in the redesigning of modern cities to improve the well-being of urban population.
We used following four datasets for our study:
- a city map of Milan, divided by 100X100 grid with information uniquely identifying each cell,
- a dataset representing the activity of incoming and outgoing calls/SMSs and Internet traffic, aggregated over the cells and over 10-minute intervals,
- a dataset, containing directional interaction strength between the different cells in the grid,
- about 500,000 geolocated tweets.
To estimate the aggregated happiness, we extracted tweets written in Italian and English. Then, the happiness score was mapped to cells according to the Point Inclusion in Polygon Test by W. Randolph Franklin. Then each cell was classified as “Happy,” if its aggregated happiness was greater than 6.35, “Unhappy,” if happiness score was less than 5.91, and “Neutral” if the score falls in-between.
To build a communication network of different urban areas we considered only “Happy” and “Unhappy” cells and then ran a community detection algorithm to estimate the presence of homophily on the cell level. As a result, we observed clearly separated communities of “Happy” and “Unhappy” cells.
Further quantitative comparison of the effect of levels of happiness (i.e. happy versus unhappy) for source and target areas using two-way Analysis of Variance (ANOVA) demonstrated its high significance. To analyze the same effect on the community level, we adopted a community detection algorithm (namely the multi-level modularity optimization algorithm) and then considered how far the community size affects the average and the standard deviation of a community’s happiness score in comparison with randomly generated artificial communities. Our findings reveal that an increase in community size results in a decrease of its happiness score. The happiness score proves to be less than that of a same-size random community, suggesting that smaller communities demonstrate a higher level of happiness. Also, all detected communities have a standard deviation less than the random communities, which proves the presence of homophily within communities.